House Affordability Calculator
Calculate how much house you can afford based on income & DTI
House Affordability Calculator
Calculation Results
Monthly Payment Breakdown and Total Cost Analysis
| Item | Monthly | Total |
|---|---|---|
| Mortgage Payment | ||
| Property Tax | ||
| Home Insurance | ||
| PMI | ||
| HOA Fee | ||
| Estimated maintenance cost (1.5%) | ||
| Total Housing Cost |
Total Cost of Homeownership Distribution
Mortgage Payment Amortization Schedule
| Year | Principal | Interest | Payments | End Balance |
|---|
| Month | Principal | Interest | Payment | End Balance |
|---|
2026 High-Rate Homebuying Insight
In a higher-rate environment, affordability is not only about the home price you qualify for. It is about whether the monthly payment remains comfortable after taxes, insurance, PMI, HOA fees, maintenance, and existing debt obligations are included.
Interest Rate Stress Test
Mortgage rates can materially change your purchasing power. The table below estimates how much house you may be able to afford if rates move lower or higher, while keeping your income, debts, down payment, taxes, insurance, HOA, and loan term unchanged.
| Scenario | Interest Rate | Estimated Affordable Home Price | Change vs. Current Rate | Monthly Housing Cost |
|---|
Front-End vs. Back-End DTI: What Lenders Actually Review
Back-end debt-to-income ratio is usually the primary affordability metric in mortgage underwriting because it includes the full picture of your monthly obligations: housing payment, car loans, credit cards, student loans, personal loans, and other recurring debt.
However, front-end DTI still matters. This is especially true for FHA loans, where lenders may review the housing-payment ratio more strictly. A borrower can have an acceptable back-end DTI but still face approval challenges if the proposed mortgage payment consumes too much of their gross monthly income.
| Loan Type | Front-End DTI Limit | Standard Back-End DTI | Back-End DTI With Compensating Factors | Key Compensating Factors |
|---|---|---|---|---|
| Conventional | 28% to 33% | Up to 45% | Up to 50% | FICO 720+, strong reserves, stable income, low loan-to-value ratio |
| FHA | 31% | 43% | Up to 57% in some AUS-approved cases | Automated underwriting approval, FICO 620+, strong payment history |
| VA | No hard front-end cap | 41% guideline | No fixed hard cap | Residual income requirement, strong credit profile, stable employment |
| Jumbo | Commonly around 28% | Commonly up to 43% | Usually not above 43% | Lender-specific rules, high reserves, excellent credit, strong assets |
These limits are general planning guidelines. Actual approval depends on the lender, loan program, automated underwriting findings, credit score, cash reserves, down payment, property type, and overall borrower profile.
How Lenders Calculate Your Income for DTI
Mortgage lenders usually calculate DTI using gross income before taxes. However, not every type of income is counted the same way. Stable W-2 salary is typically the easiest to verify, while variable income such as bonus, commission, overtime, RSU income, rental income, and self-employment income usually requires a longer history.
| Income Type | How It Is Usually Counted | Key Requirements |
|---|---|---|
| W-2 Base Salary | Current monthly gross income from recent pay stubs | Usually the most straightforward income source |
| Bonus or Commission | Typically averaged over 24 months | Usually requires a 2-year history and likelihood of continuance |
| RSU or Stock Compensation | Often averaged based on a 2-year vesting history | Usually requires vesting history, employer documentation, and publicly traded stock |
| Overtime Pay | Typically averaged over 24 months | Usually requires a 2-year continuous overtime history |
| Rental Income | Often counted as 75% of gross rent or based on tax return treatment | 25% may be deducted for vacancy, maintenance, and operating risk |
| Self-Employment or 1099 Income | Usually based on a 2-year average of net business income | Schedule C, business tax returns, depreciation, amortization, and add-backs may matter |
For borrowers with variable or self-employed income, the income shown on a mortgage application may be lower than the income they personally feel they earn. This is one reason high-income borrowers can still qualify for less home than expected.
Real-World Affordability Case Studies
Case Study 1: Mr. W from Texas
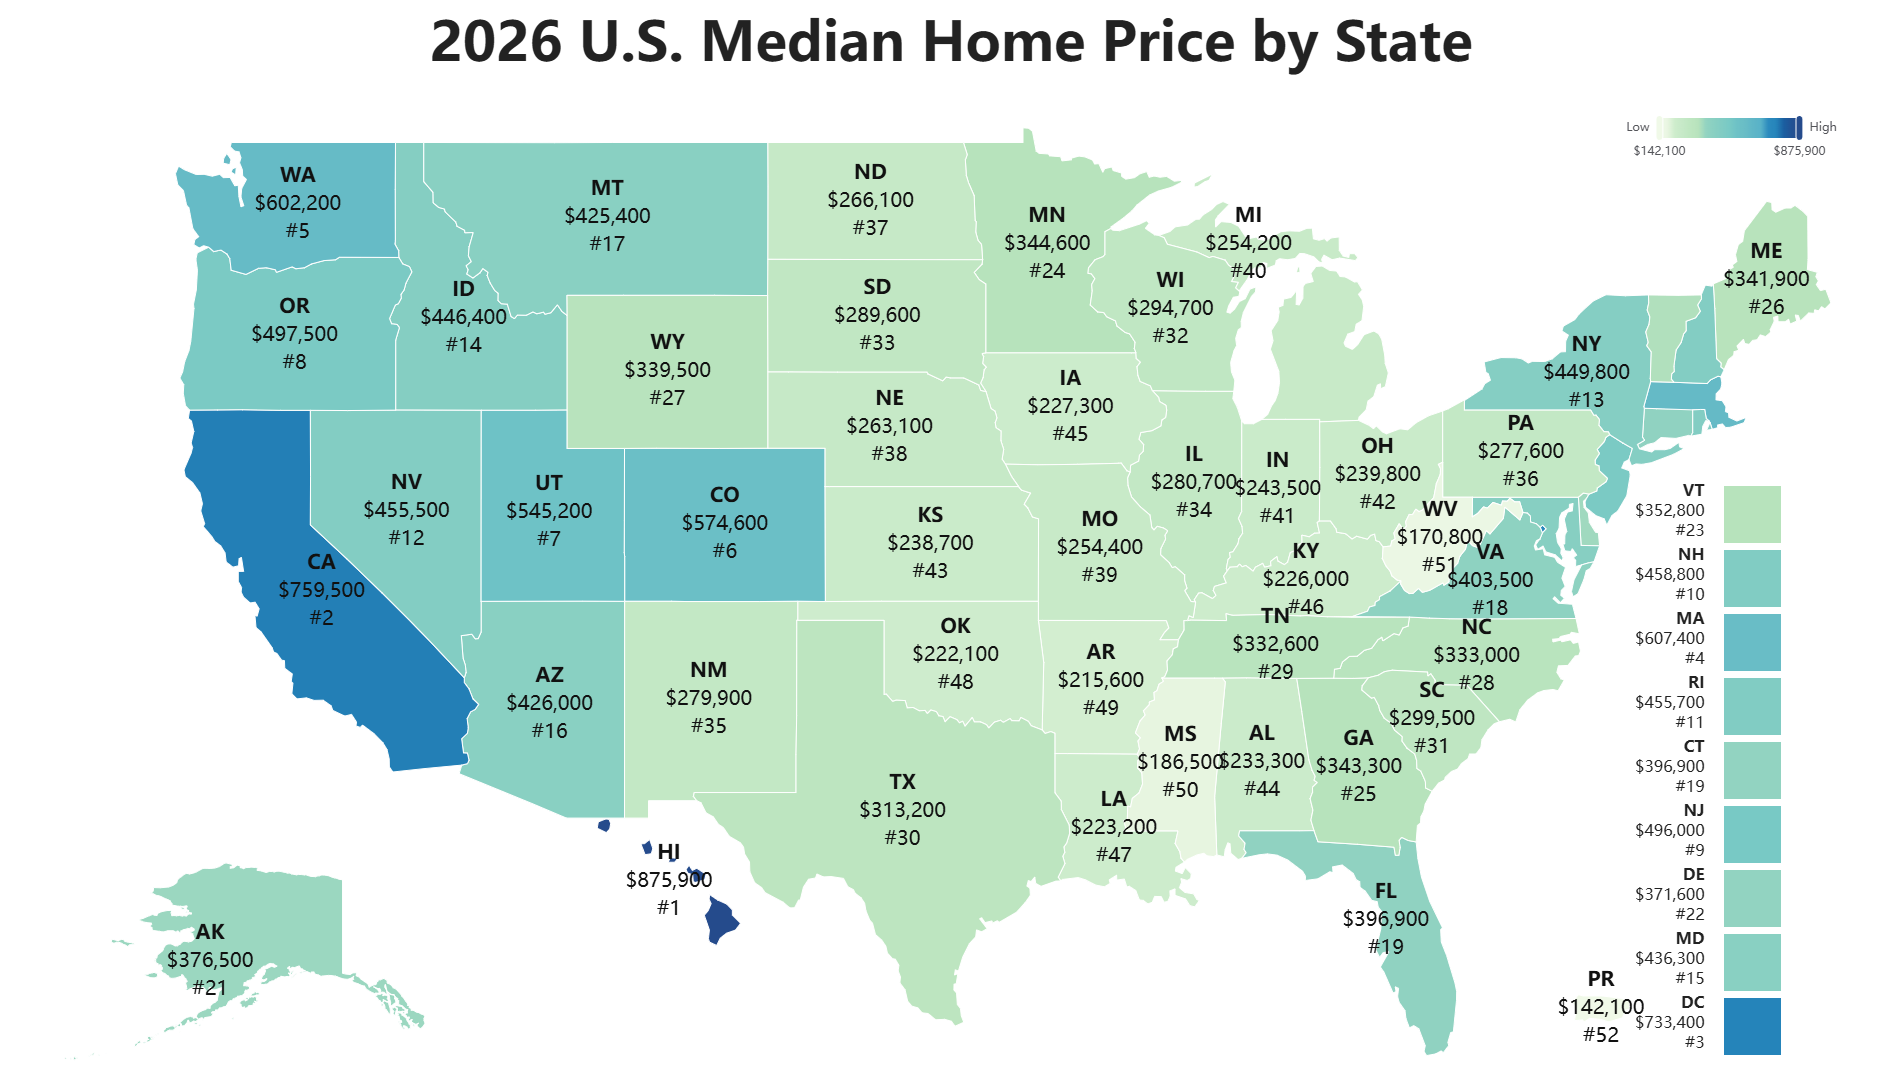
Mr. W earns $120,000 per year and carries a $500 monthly car payment. At first glance, his income appears strong enough to support a sizable mortgage. However, because many Texas markets have property tax rates close to or above 2% annually, his monthly tax burden significantly reduces his actual purchasing power.
In this situation, the limiting factor is not only the mortgage principal and interest payment. Property taxes, insurance, and existing debt push his back-end DTI higher. A buyer like Mr. W may qualify for less home than expected unless he increases the down payment, reduces other debt, or chooses a lower-priced property.
Case Study 2: A First-Time Buyer with Low Debt
A buyer earning $85,000 annually with no major monthly debt may have more flexibility than someone with the same income but large auto loans or credit card payments. Even so, at elevated mortgage rates, every 0.5% rate increase can meaningfully reduce buying power.
For this type of borrower, the safest strategy is often to qualify below the maximum lender limit. Keeping a reserve for maintenance, insurance increases, and unexpected expenses can be more important than purchasing at the absolute top of the approved range.
How Do I Calculate How Much I Qualify for a Home Loan?
Rough calculation steps:
- Calculate your maximum allowable monthly debt payment using your income and DTI, such as 36% of monthly income.
- Subtract your existing monthly debts, including car loans, credit cards, and student loans, to estimate your maximum housing payment.
- Use a mortgage calculator with that payment, interest rate, and loan term to estimate the loan amount.
For example, if your gross monthly income is $6,000 and your lender allows 36% DTI:
$6,000 × 0.36 = $2,160 maximum total debt payments
If your current debts total $500/month, your maximum mortgage payment is $2,160 - $500 = $1,660.
Using a mortgage calculator with $1,660/month, 4% interest, and 30-year term, you might qualify for about $347,000.
For precise qualification, consult with lenders or use the calculator on this page.
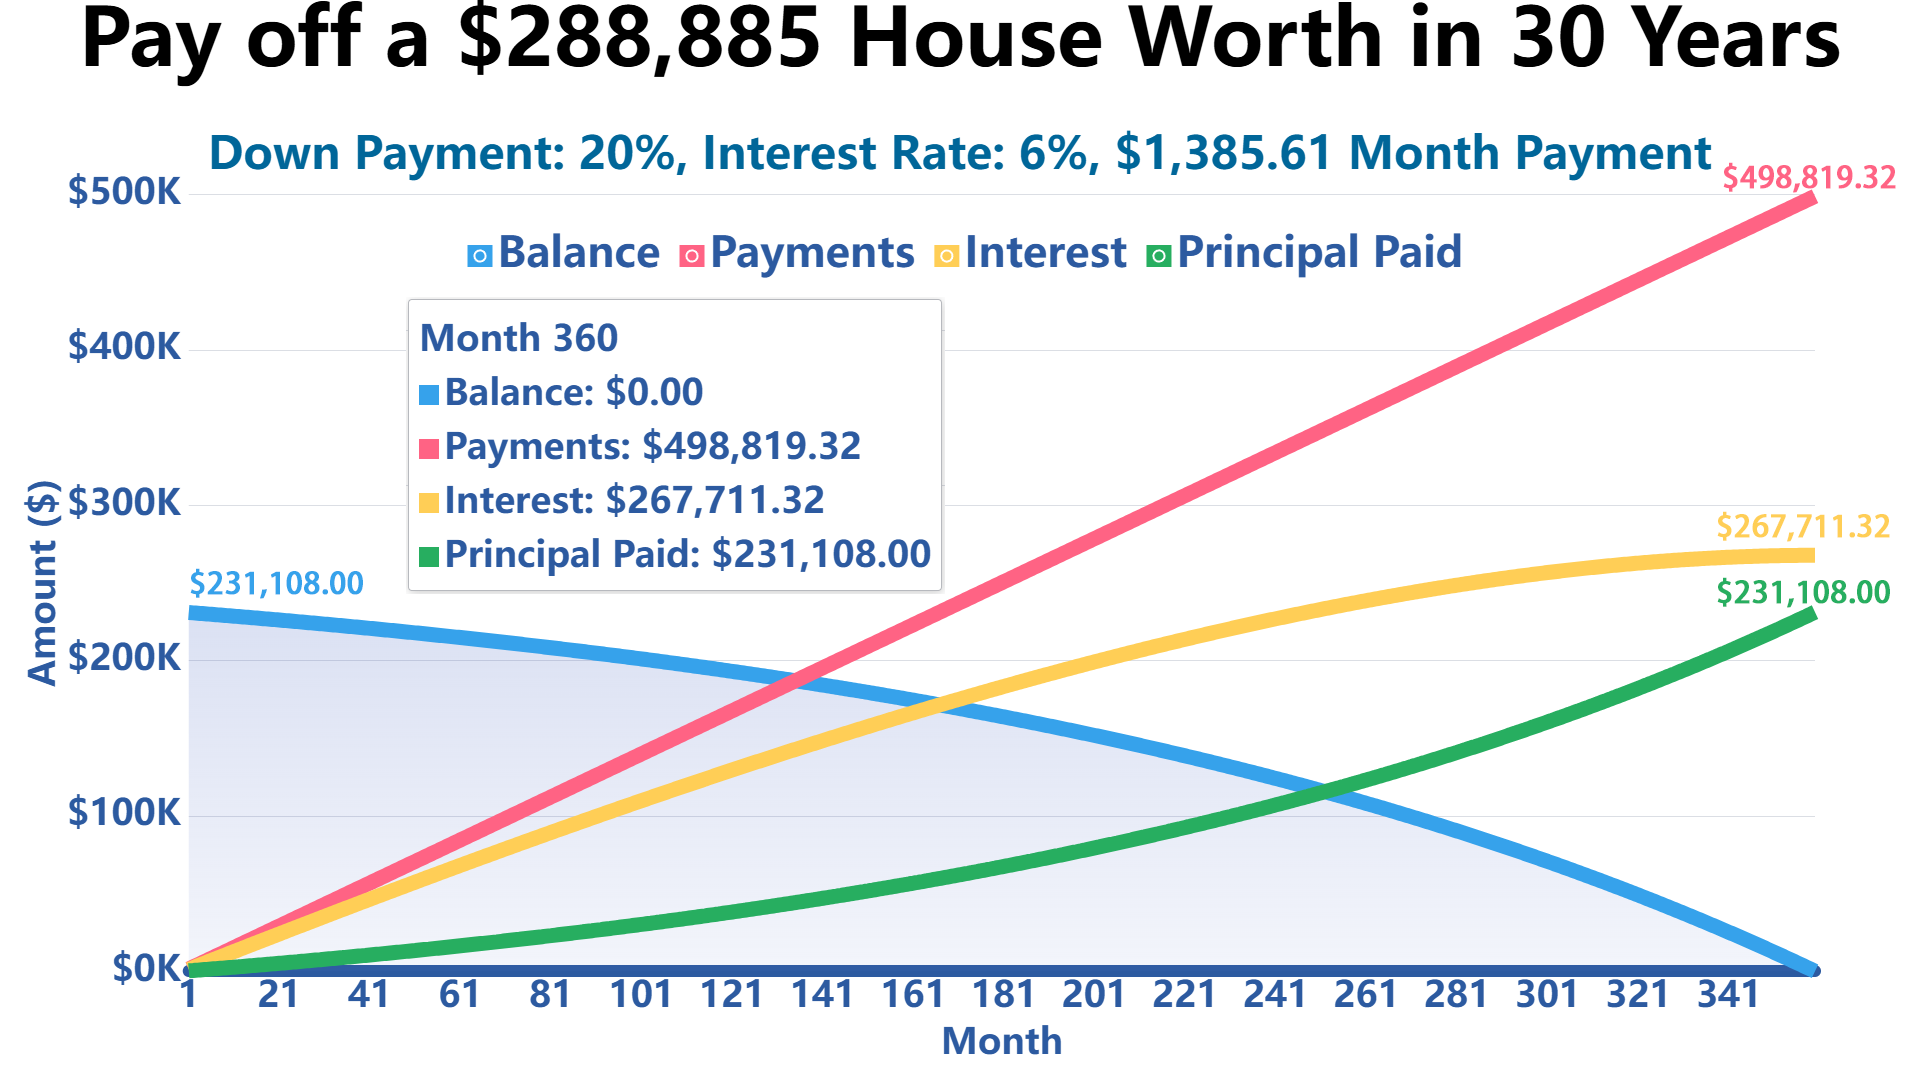
With an Annual Income of $80,000, How Much Can I Afford in a House?
If you're looking at a 30-year term with 20% down, a fixed rate of 6%, property tax at 1.5% per year, and home insurance at 0.5% per year, then based on the 28/36 rule, you can afford a house worth about $288,885.
Why Interest Rate Stress Testing Matters
A small change in mortgage rates can create a large change in affordability. When rates rise, more of your monthly payment goes toward interest instead of principal. That means the same income supports a smaller loan amount and, in many cases, a lower home price.
This calculator includes an interest rate stress test to show how your estimated purchasing power may change if mortgage rates move up or down by one percentage point. This is especially useful for buyers comparing pre-approval numbers, waiting for a rate lock, or shopping in competitive markets.
Why the 28/36 Rule Still Matters in 2026
The 28/36 rule is a traditional mortgage affordability guideline. It suggests that your monthly housing cost should generally stay at or below 28% of gross monthly income, while total monthly debt payments should generally stay at or below 36%.
In a high-rate environment, this rule becomes even more important. Higher interest rates increase the monthly cost of borrowing, while property taxes, insurance premiums, HOA fees, and maintenance costs can continue rising after you buy the home. Staying within conservative DTI limits can help reduce the risk of becoming house poor.
How Property Taxes Can Limit Buying Power
Property taxes can materially affect affordability, especially in states or counties with higher tax rates. Two buyers with the same income, debt, interest rate, and down payment may qualify for different home prices if one is buying in an area with significantly higher property taxes.
For example, a buyer earning $120,000 per year with a $500 monthly car payment may appear well-qualified. But if the local property tax rate is 2% annually, a larger share of the monthly housing budget goes to taxes instead of mortgage principal and interest. This can reduce the affordable home price by tens of thousands of dollars.
References
This calculator's methodologies and guidelines are based on information from authoritative sources:
Government Resources:
- Federal Housing Administration (FHA): HUD.gov - FHA Loan Programs
- Department of Veterans Affairs: VA.gov - Home Loan Programs
- Consumer Financial Protection Bureau: ConsumerFinance.gov - Owning a Home
- Federal Trade Commission: Consumer.FTC.gov - Homes and Mortgages
- Federal Reserve: FederalReserve.gov - Household Debt Research
- U.S. Census Bureau: Census.gov - Housing Statistics
Write Reply to This Calculator